

The business case for CodeScene
The impact in monetary terms
Scenarios based on different average codebase health and team size
Opportunity cost measured in monetary terms
Each developer @ £60k P.A.
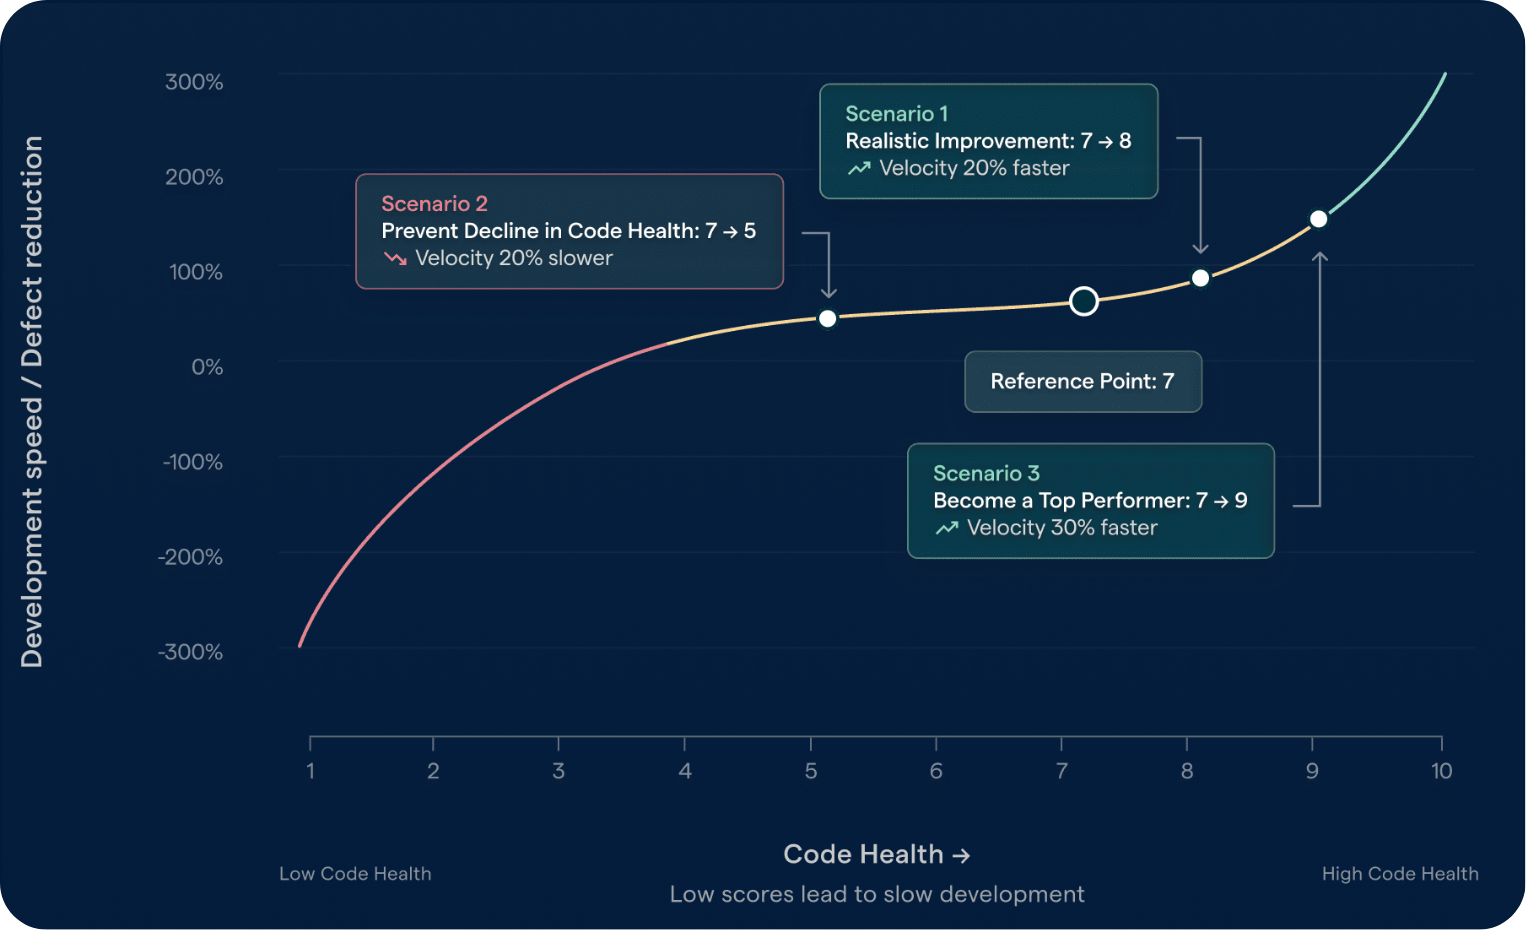
| Scenario | Change & impact |
10 Devs £600k total |
50 Devs £3m total |
100 Devs £6m total |
|---|---|---|---|---|
| Lower quality |
7→5 −20% |
–£120k | –£600k | –£1.2m |
| Better quality |
7→8 +20% |
+£120k | +£600k | +£1.2m |
| Top performer |
7→9 +30% |
+£180k | +£900k | +£1.8m |
Sources
Benchmarking Code Health Refactoring ROI
The research behind the S-curve — a polynomial regression across 50+ production codebases linking Code Health scores to development speed and defect reduction.
codescene.com/blog/benchmarking-code-health-refactoring-roi
Code Red — The Business Impact of Code Quality
The peer-reviewed paper establishing the link between code quality and business outcomes across 39 proprietary production codebases.
arxiv.org/abs/2203.04374
Code Quality: Debunking the Speed vs Quality Myth
How the non-linear S-curve model translates Code Health scores into tangible business value — faster delivery and fewer defects.
codescene.com/blog/code-quality-debunking-the-speed-vs-quality-myth